Consider a retail and distribution business preparing for its quarterly review. The finance director asks a straightforward question: has the growth in inventory since January eroded gross margin, and if so, in which product categories? The data needed to answer it already exists, spread across the point-of-sale system, the warehouse system and the finance ledger. No existing dashboard brings these sources together, so the request is passed to an analyst, who exports the files, reconciles dates and product codes, and builds a chart. The answer arrives two days later, after the review has concluded.
The pattern is common. In Anaconda's 2022 State of Data Science survey of 3,493 respondents, data professionals reported spending almost 38 per cent of their time on data preparation and cleansing (Anaconda, 2022). Gartner estimates that 80 to 90 per cent of new enterprise data is unstructured, held in documents rather than tables (Gartner, via GeekWire), and only a small fraction of it informs routine reporting. For most organisations, the constraint is no longer the availability of data but the time it takes to convert a question into a reliable answer.
Agentic AI offers a different operating model. Rather than relying on analysts to build each answer or on dashboards to anticipate each question, organisations can deploy coordinated AI agents that plan, retrieve, verify, and present answers on demand, within rules defined by the business. This article examines the limits of the current model, describes how an agentic approach works in practice and sets out the capabilities that determine whether its answers can be trusted.
The limits of today's reporting model
Most organisations rely on two routes from question to answer: pre-built dashboards and manual analysis. Each has a structural limitation that becomes more pronounced as demand for insight grows.
Dashboards answer only the questions they were designed for. Business intelligence tools such as Power BI have made standard reporting faster and more widely accessible. A well-designed dashboard refreshes on a schedule and gives every user a consistent view of revenue, margin or stock levels. However, every genuinely new question requires someone to specify it, model the underlying data and build a new view. These requests accumulate in a queue, and analytics capacity rarely grows in line with demand. Dashboards also cannot draw on documents, so the context held in supplier contracts, audit findings, standard operating procedures and annual reports remains outside the reporting layer.
Manual analysis neither scales nor compounds. When a dashboard cannot answer a question, the default is a bespoke analysis, which introduces three persistent problems:
- Inconsistent definitions. One analyst calculates revenue net of returns; another also excludes internal transfers. Both figures are defensible, yet they cannot both appear in the same board pack.
- Fragmented formats. The same date may be recorded as "Jan 10" in one system, "01/10.2026" in another and "2026.01/10" in a third. Product codes, store names and units vary in similar ways.
- Work that is not reused. A question answered in March is often rebuilt from scratch in June, because the spreadsheet behind it was never designed for reuse.
Errors also travel quietly through these processes. An outdated price list or a duplicated supplier invoice can pass through several hands and reach a management report before it is detected.
What organisations need is a way for any authorised user to ask a question in plain language and receive an answer that is consistent, verified and limited to what that user is permitted to see.
An agentic model for business intelligence
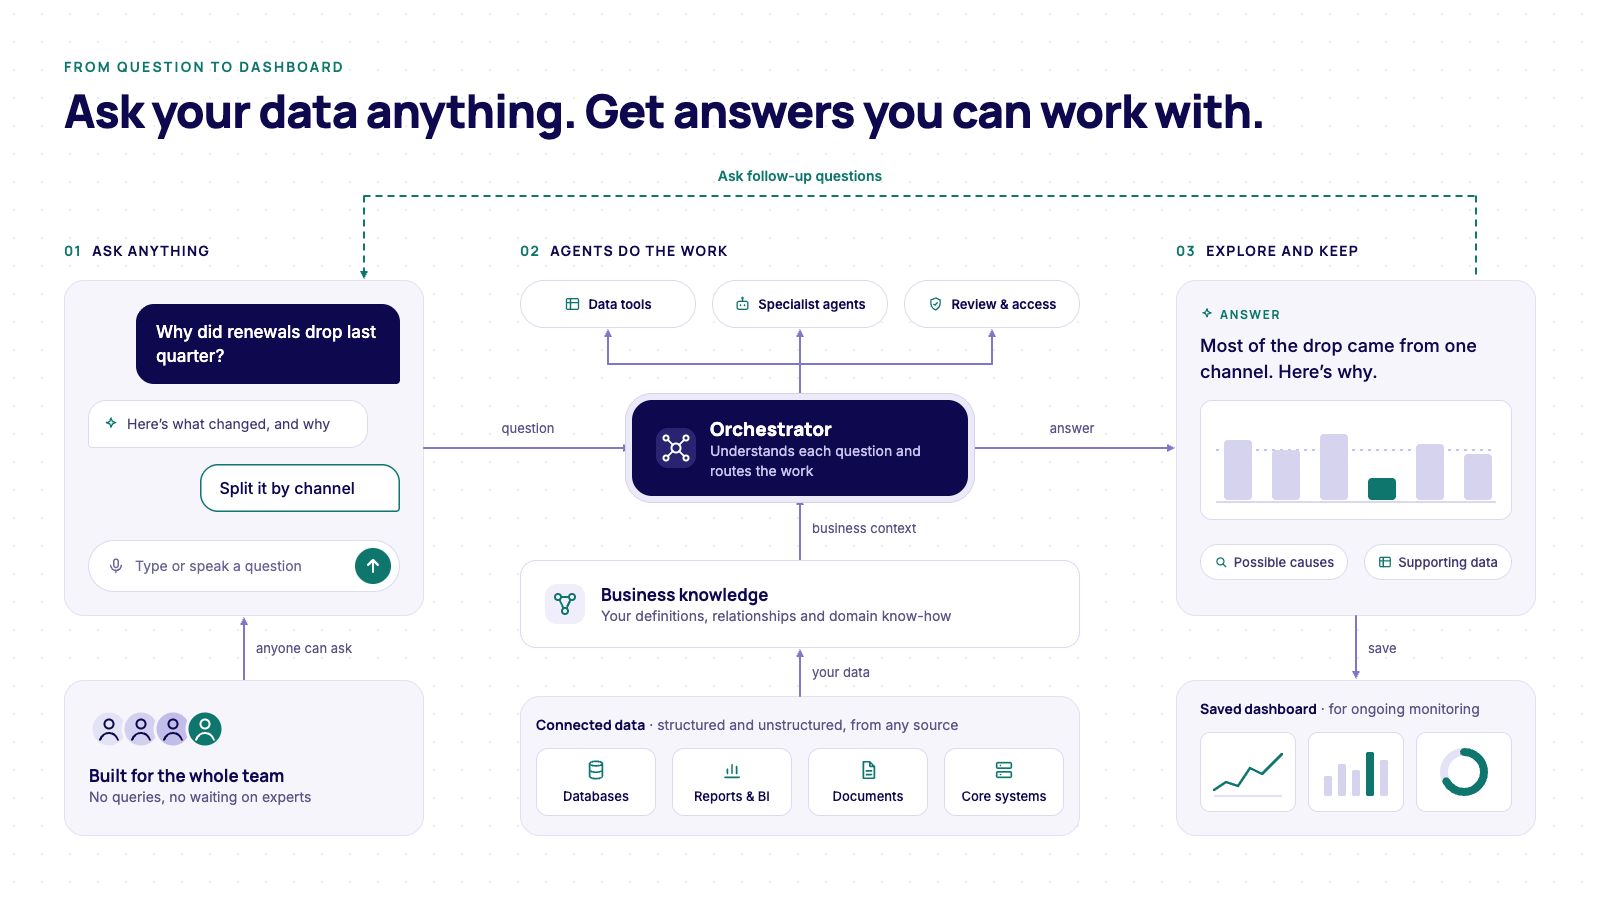
Kainovation's Agentic Intelligence Platform is built on this premise. It provides a single interface through which users can ask questions of the organisation's data and receive a verified answer, whether a single figure, a table, a chart or a complete dashboard. Each answer is produced by a coordinated set of AI agents, each accountable for one step in the process:
- Orchestrator. Interprets the question, identifies the data and definitions required, and allocates the work. Complex questions are decomposed into parts that run in parallel.
- Query builder. Consults the organisation's data definitions, identifies the relevant tables and columns, and writes the query that retrieves the data.
- Critic. Reviews the draft answer before it reaches the user, testing whether the correct tables, columns and date ranges were used and whether the result is consistent with related data. Answers that do not meet the standard are returned for revision.
- Widget builder. Selects the presentation best suited to the question and the data, such as a line chart for a trend over time or a pie chart for a composition. A dedicated reviewer checks the visual with the same rigour applied to the numbers.
Two further features distinguish this model from a conventional query assistant. First, the process is transparent: users can follow each step as it happens, including the queries executed and the rows returned. Second, the level of scrutiny is adjustable. A quick mode suits a single figure, an auto mode suits routine questions, and a deep mode applies adversarial review to numbers destined for a board pack or regulatory filing. Answers that prove useful can be saved and scheduled as recurring reports.
Four capabilities that make answers dependable
Speed creates little value if users cannot rely on the result. In practice, the trustworthiness of an AI-generated answer depends on four underlying capabilities.
Shared definition for every metric
Without agreed definitions, an AI system asked for "profit" will infer a calculation from column names and may infer a different one the next time. The platform addresses this through a semantic layer, in which business logic is recorded once: how profit is calculated, what revenue excludes, which currency is used for reporting and what each role may access. Every agent consults these definitions before writing a query, so the same question yields the same answer regardless of who asks it or how it is phrased. Incoming data is also standardised as it is loaded, so that dates, codes and formats from different systems arrive in a consistent form.
Structured and unstructured data connected in one model
The platform maintains a knowledge graph that links tables and documents to the same underlying entities: products, stores, regions, suppliers and customers. When a supplier recall notice is uploaded, its contents are attached to the affected product, allowing an answer about that product's sales performance to cite the notice directly.
The graph is not limited to transactional data. The unstructured knowledge an organisation already holds, such as internal policies, standard operating procedures and market analyses, can be connected to the platform in the same way and linked to the entities it describes. Answers then reflect not only what the numbers show but also the rules and context that govern them. The same approach extends to any domain where knowledge is held in free text. In healthcare, for example, agents could analyse years of patient notes to identify symptoms commonly recorded among patients prescribed a particular medicine, an analysis that conventional BI tools are not designed to perform.
Data quality enforced before analysis, not after
Quality checks run on a schedule against source tables, testing for freshness, completeness, duplication, valid ranges and other conditions. Rows that fail a blocking check are held in the pipeline before they can reach the data the agents query. A price list that has not been updated in three days cannot distort a margin report, and an invoice loaded twice cannot double a cost line. Each held row enters a review queue with a proposed correction, and the data team decides whether to apply the fix, release the row or remove it.
Access control and auditability by design
Every query is restricted to the requesting user before it runs. Senior leaders can see the whole organisation, regional managers their own region and sales representatives only their own customers. Where an access rule is missing, the platform returns no data rather than the wrong data. The platform operates within the organisation's own cloud environment, without copying data to an external warehouse. Every question is logged with its plan, queries, source rows and final answer, and any change to definitions, quality rules or access settings requires approval from two people.
Where the value accrues
Across the organisation: The benefits are not confined to any one function, role or industry. Any employee who works with data, from senior leaders to frontline staff and the data and analytics team itself, can ask a question in plain language and receive an answer directly, rather than commissioning a report and waiting for it. Each answer applies the same agreed definitions and is scoped to what that person's role permits them to see. For analysts, time shifts from data preparation and one-off reporting to work that requires their judgement.
Beyond the organisation: The same access controls allow the platform to be extended to partners and customers. Consider a business that hold
s data for five corporate customers. Each customer can be given its own login and query the platform directly, seeing only the data that relates to its own account and never another customer's. Customers gain self-service answers about their own business, while the organisation maintains a single platform, a single set of definitions and a single point of control.
Implications for leaders
Most organisations already hold the data required to answer their most important questions. What they lack is a dependable mechanism for converting a new question into a verified answer without waiting for it to be built. Today, that mechanism often depends on a small number of analysts with limited capacity.
Leaders considering an agentic approach can begin with three steps. First, agree and codify the definitions of the metrics that matter most, since these govern every answer that follows. Second, assess the quality of source data before enforcing controls, for example by running quality checks in preview against historical data to see what they would catch. Third, identify the recurring questions that currently consume the most analyst time, as these offer the clearest early return.
Organisations that make these foundations explicit will be better placed to move from reports that describe the past to answers that inform decisions as they are being made.